
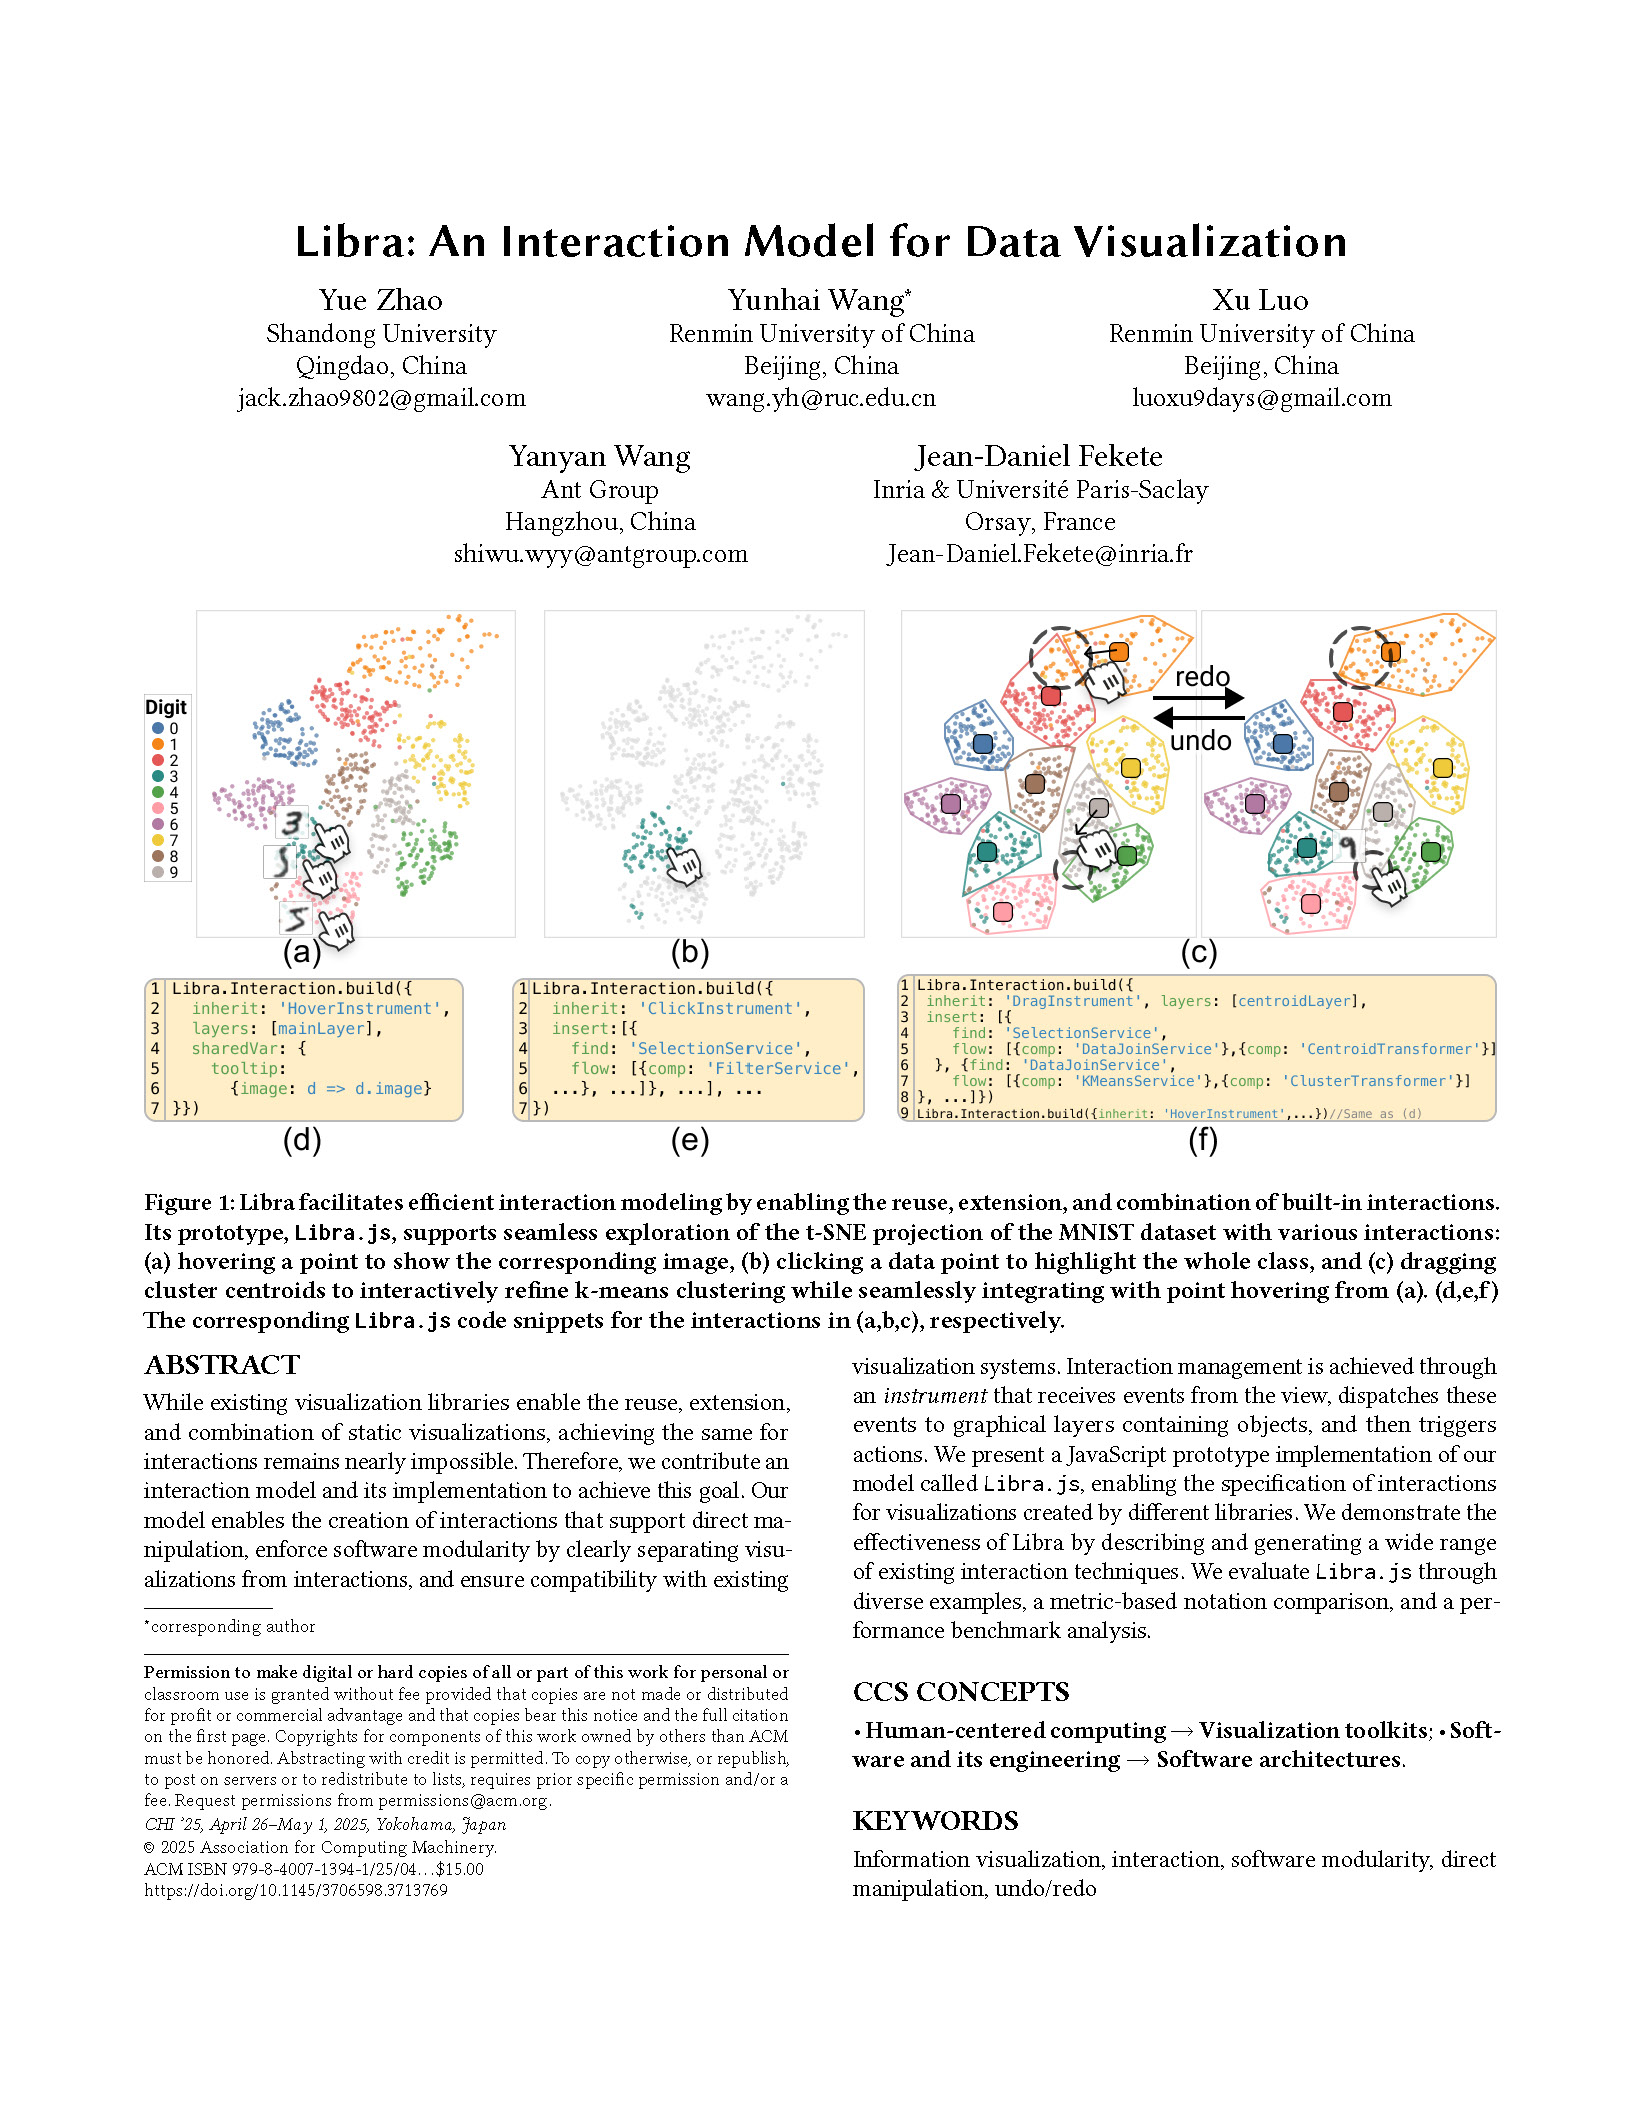
Figure 1: Libra facilitates efficient interaction modeling by enabling the reuse, extension, and combination of built-in interactions. Its prototype, Libra.js, supports seamless exploration of the t-SNE projection of the MNIST dataset with various interactions: (a) hovering a point to show the corresponding image, (b) clicking a data point to highlight the whole class, and (c) dragging cluster centroids to interactively refine k-means clustering while seamlessly integrating with point hovering from (a). (d,e,f) The corresponding Libra.js code snippets for the interactions in (a,b,c), respectively.
Abstract
While existing visualization libraries enable the reuse, extension, and combination of static visualizations, achieving the same for interactions remains nearly impossible.
Therefore, we contribute an interaction model and its implementation to achieve this goal. Our model enables the creation of interactions that support direct manipulation, enforce software modularity by clearly separating visualizations from interactions, and ensure compatibility with existing visualization systems.
Interaction management is achieved through an instrument that receives events from the view, dispatches these events to graphical layers containing objects, and then triggers actions.
We present a JavaScript prototype implementation of our model called Libra, enabling the specification of interactions for visualizations created by different libraries.
We demonstrate the effectiveness of Libra by describing and generating a wide range of existing interaction techniques. We evaluate Libra.js through diverse examples, a metric-based notation comparison, and a performance benchmark analysis.
Links
- Project Page: https://libra-js.github.io/
Our Model

Figure 2: Our interaction model (a) and the communication between components within an instrument (b). (a) The top row represents the visualization reference model, where our model wraps the visual mapping and view rendering into a graphical transformer. The bottom row corresponds to the instrument for manipulating the three stages. The objects resulting from the interactions, transient or persistent, are shown on the new layers, their associated visual effects updating the view. (b) For the input events, the instrument first interprets them in the context of the layers and uses an interactor to translate them into high-level actions. These actions subsequently use the selection service or other services, and produce interaction effects—feedforward and feedback—that are shown in their corresponding layers, and commands that enable undo/redo.

Figure 3: Illustrating the design of a new instrument with Libra.js. (a) The specifications for creating an excentric labeling instrument; (b) the specifications for creating a new layout service and the corresponding transformer; (c) (top left) The components used for composing an excentric labeling instrument to support this interaction for scatterplots; (bottom left) the main layer and the other three layers generated by interactions; and (right) the final result.

Figure 4: Extending the trace interactor used by the drag instrument in Figure 1c to support touch operations. (a) The Libra.js specification that adds the touch operations to the interactor; (b) a state machine with the transition between states triggered by different low-level events.
Expressiveness

Figure 5: Examples of reusing built-in instruments: (a) hovering, (b) multiple clicking, and (c) brushing; and (d) a code snippet for gluing existing visualizations with Libra.js’s instrument.

Figure 6: Comparing the implementations of Libra.js, D3 and Vega-Lite for the panning & zooming. (a) The snapshots for zooming a scatterplot. (b) The Libra.js specification consists of the separated pan and zoom instruments, and (c,d) the D3 implementation and Vega-Lite specifications coupling pan and zoom operations.

Figure 7: Example of composing instruments for implementing (a) the index chart and (b) corresponding code snippets for composing these new instruments with Libra.js.

Figure 8: Implementing the DimpVis interaction technique. (a) Two snapshots of this interaction; (b) Libra specification (custom components in orange); and (c) communication between all components, where the orange ones are defined by ID. (d) D3 code requiring ID to provide callback functions for all three events. (e) Vega specification for finding the point nearest to the point dragged on the time trajectory
Benchmark

Figure 9: We run 1k bootstrapped variations for each metric based on our gallery, with (a-c) and without the static visualization code (d), and show the results via a scatter plot with a Kernel Density Estimation (KDE) of each pair of metrics: specification length, vocabulary size, and sprawl. Each scatter represents the median value of one variation, while the shaded regions represent the areas containing 75% of the probability mass of each library’s KDE distribution.

Figure 10: Average frame rates for three interactive visualizations (higher means faster): where (a) brushing and linking on a scatterplot matrix; (b) brushing and linking on an overview+detail visualization; and (c) panning and zooming on a scatterplot.
Materials:
|
 |
| Paper (2.4M) | Supp. (2.3M) |
Acknowledgements
This work is supported by the grants of the National Key R&D Program of China under Grant 2022ZD0160805, NSFC (No.62132017 and No.U2436209), the Shandong Provincial Natural Science Foundation (No.ZQ2022JQ32), the Beijing Natural Science Foundation (L247027), the Fundamental Research Funds for the Central Universities, and the Research Funds of Renmin University of China. The authors thank Andrew M. McNutt and Oliver Deussen for their valuable suggestions.