Taurus: Towards A Unified Force Representation and
Universal Solver for Graph Layout
(Proceedings of IEEE VIS 2022)
Mingliang Xue1
Zhi Wang1
Fahai Zhong1
Yong Wang
2
Oliver Deussen
3
Yunhai Wang
1
1Shandong University
2Singapore Management University
3Konstanz University, Germany
Abstract:
Over the past few decades, a large number of graph layout techniques have been proposed for visualizing graphs from various domains. In this paper, we present a general framework, Taurus, for unifying popular techniques such as the spring- electrical model, stress model, and maxent-stress model. It is based on a unified force representation, which formulates most existing techniques as a combination of quotient-based forces that combine power functions of graph-theoretical and Euclidean distances. This representation enables us to compare the strengths and weaknesses of existing techniques, while facilitating the development of new methods. Based on this, we propose a new balanced stress model (BSM) that is able to layout graphs in superior quality. In addition, we introduce a universal augmented stochastic gradient descent (SGD) optimizer that efficiently finds proper solutions for all layout techniques. To demonstrate the power of our framework, we conduct a comprehensive evaluation of existing techniques on a large number of synthetic and real graphs. We release an open-source package, which facilitates easy comparison of different graph layout methods for any graph input as well as effectively creating customized graph layout techniques.
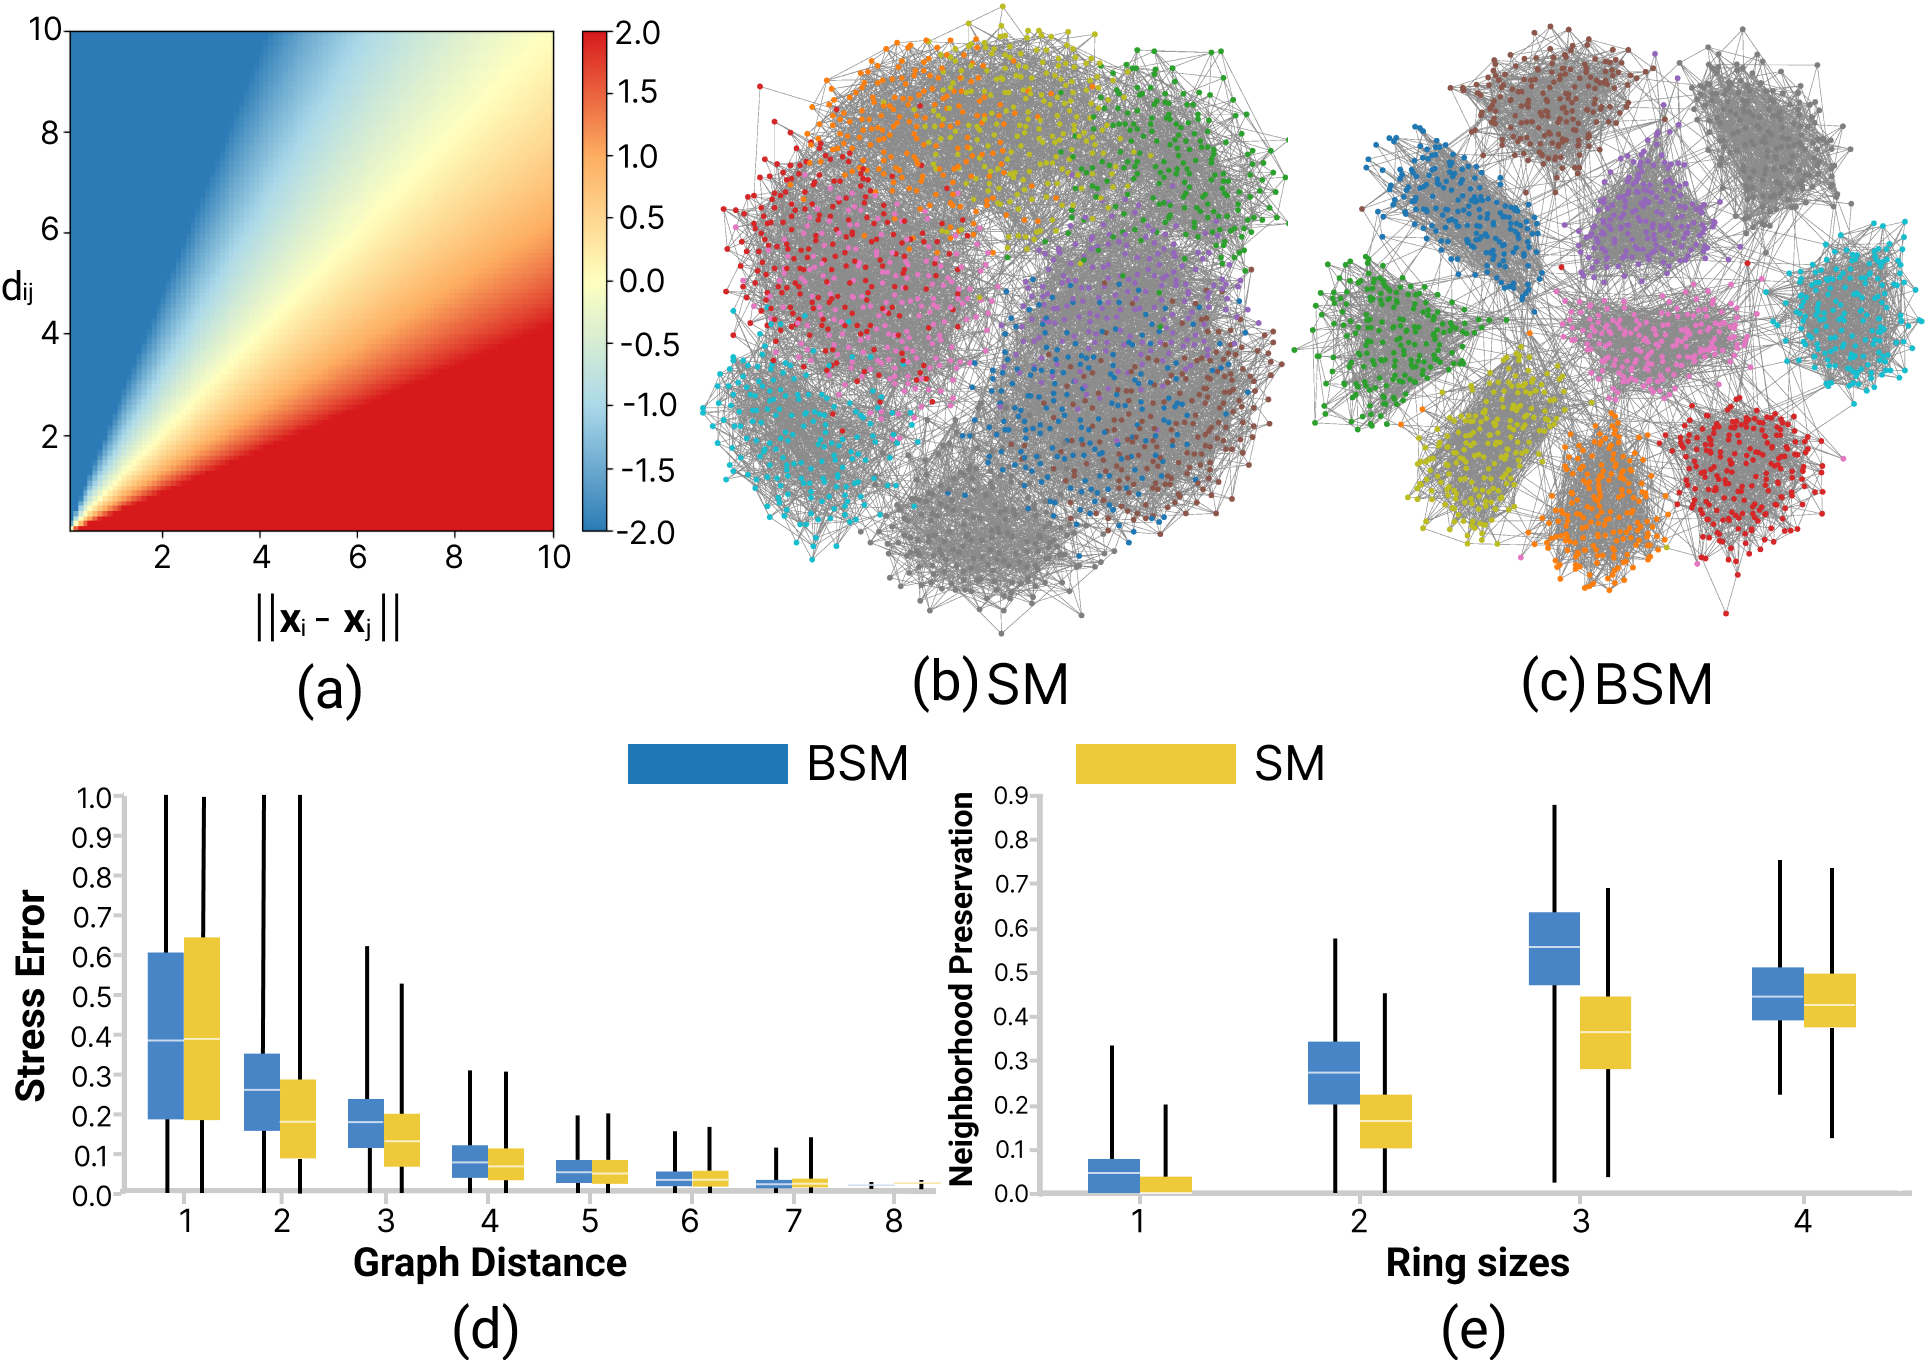
Figure 1:
(a) Resultant force for two nodes with varying graph-theoretical
and Euclidian distances generated by our balanced SM. (b) Layouts
generated by SM and balanced SM (c) on the graph cluster_2000.
Our method clearly separates different clusters. (d,e) The boxplots
summarize the value ranges (same for all boxplots in this paper) of the
stress error (d) in terms of different graph distances and neighborhood
preservation (e) degrees for different ring sizes. Figure 2:
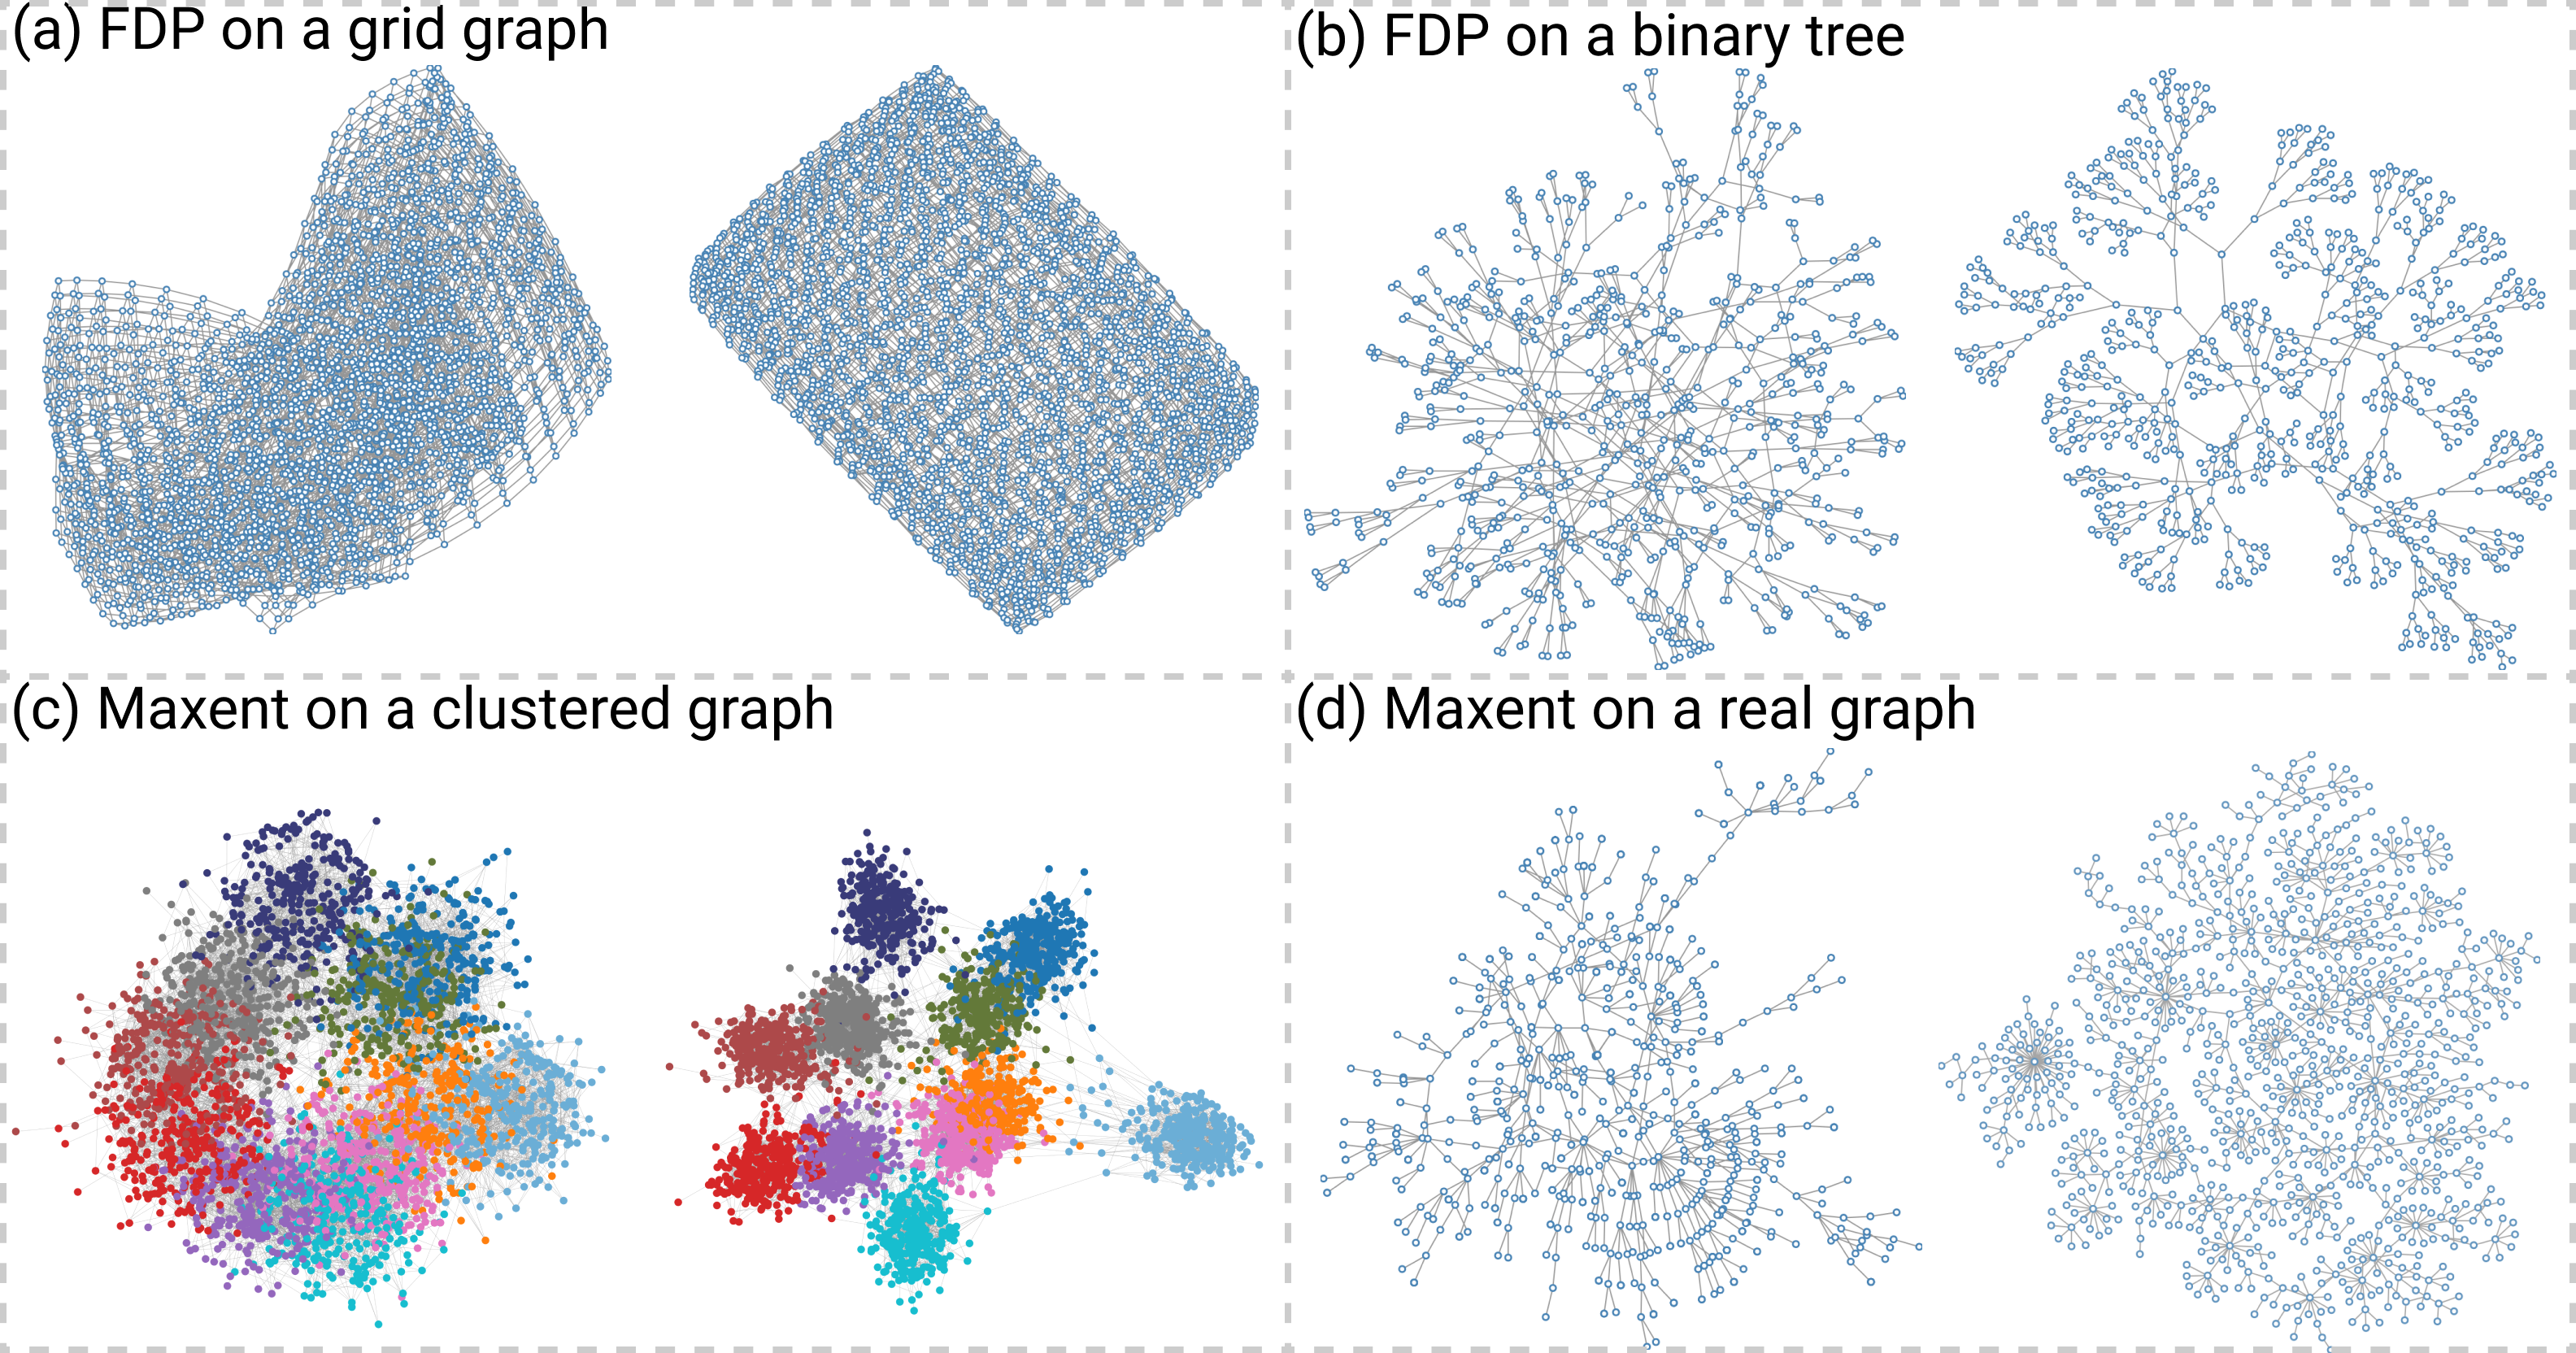
Comparison of layout results on the same data generated by
the same methods using the existing implementation (left) and our
implementation (right). (a,b) Results generated by FDP; (c,d) results
generated by Maxent.
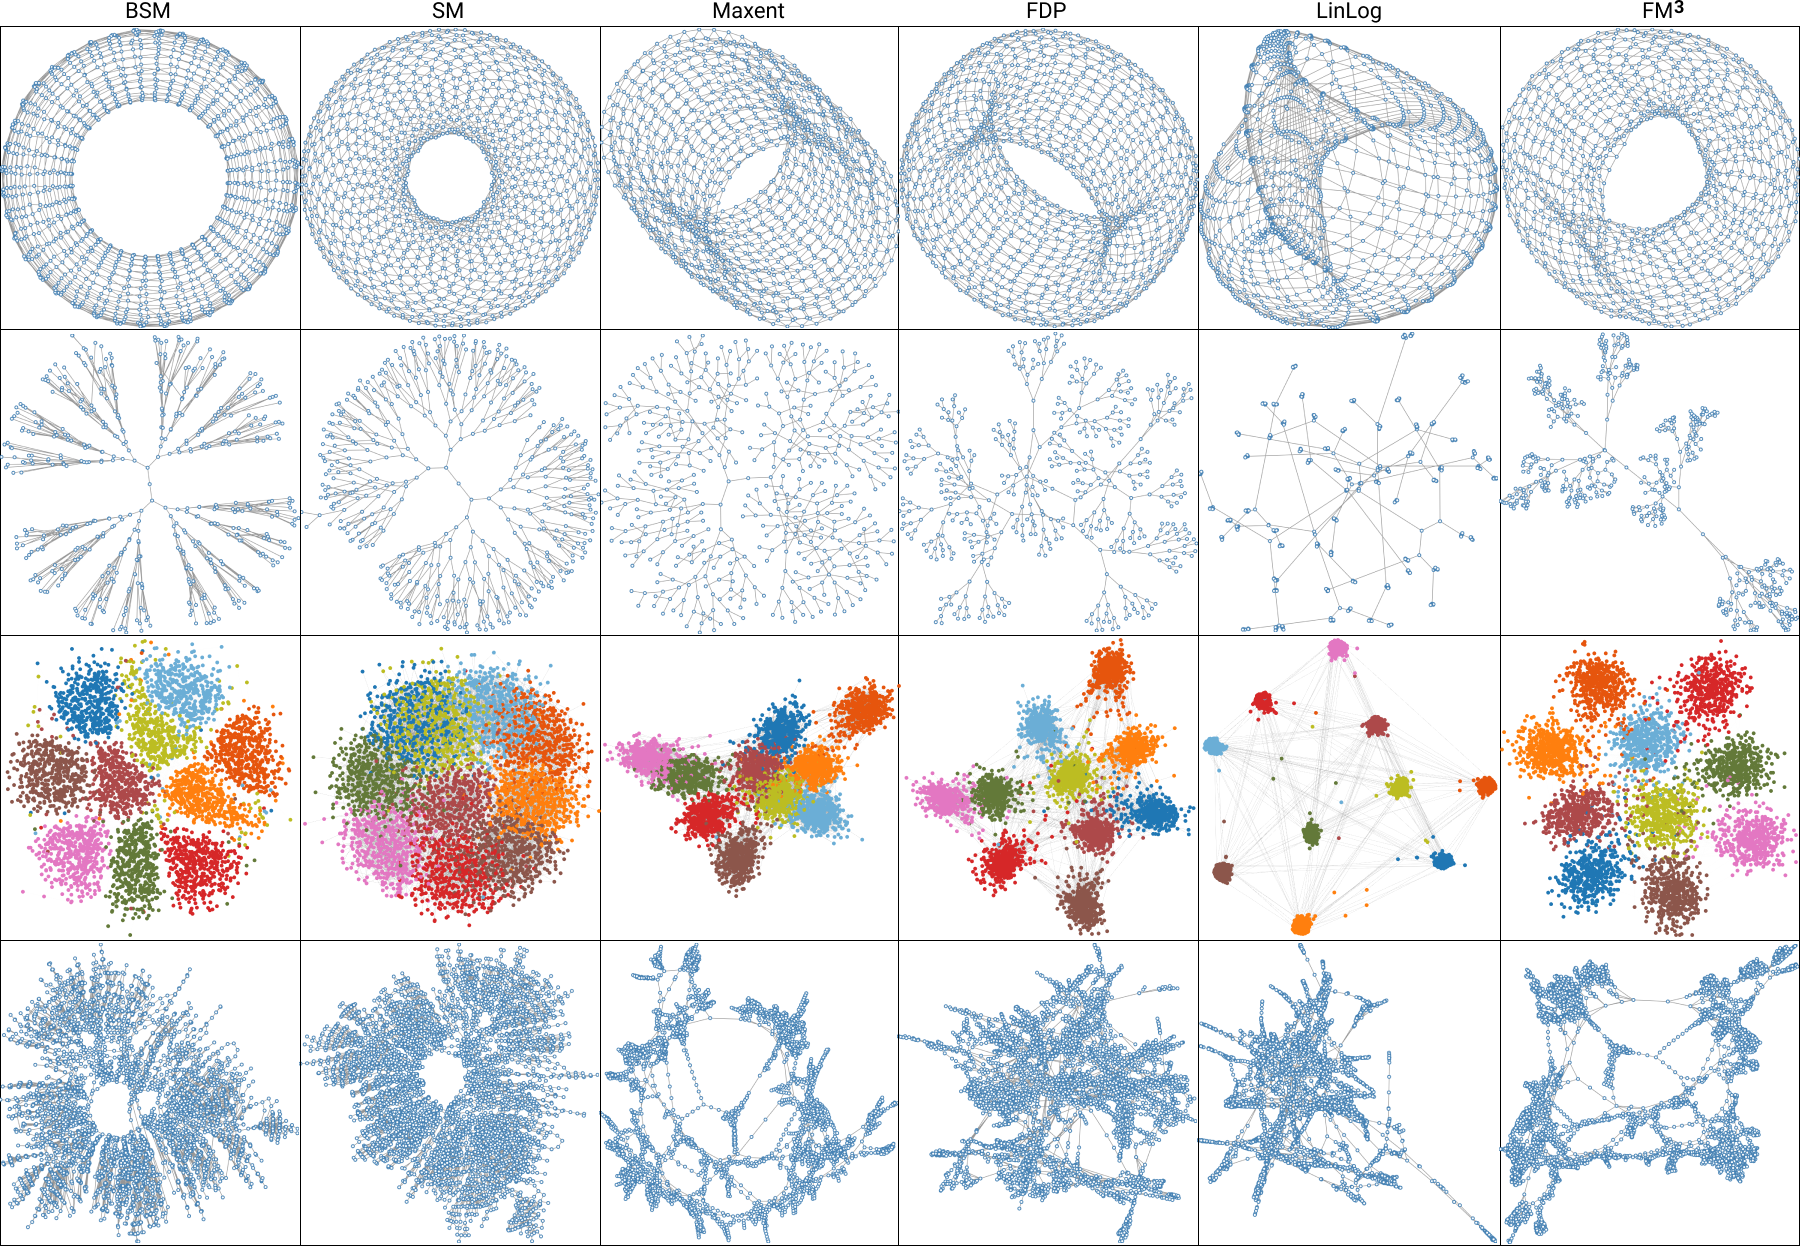
Figure 3:
SM results of four graphs (top down: grid_1000, btree_513, cluster_4463, and US_powergrid) with different structures in comparison to
baseline methods (SM, FDP, LinLog, Maxent and FM3) implemented by Taurus.
This work was supported by the grants of the National Key Research and Development Program of China (2018AAA0101100), and NSFC (62132017, 62141217). Oliver Deussen was funded by the German Research Foundation (DFG) - Project-ID 2,51654672 - TRR 161.
Online Demo: taurusgl.github.io
Source Code: github.com/Ideas-Laboratory/Taurus
Results:
Materials:
Paper: [PDF 7.51M].
Supp: [PDF 64.7M].
Acknowledgements: