
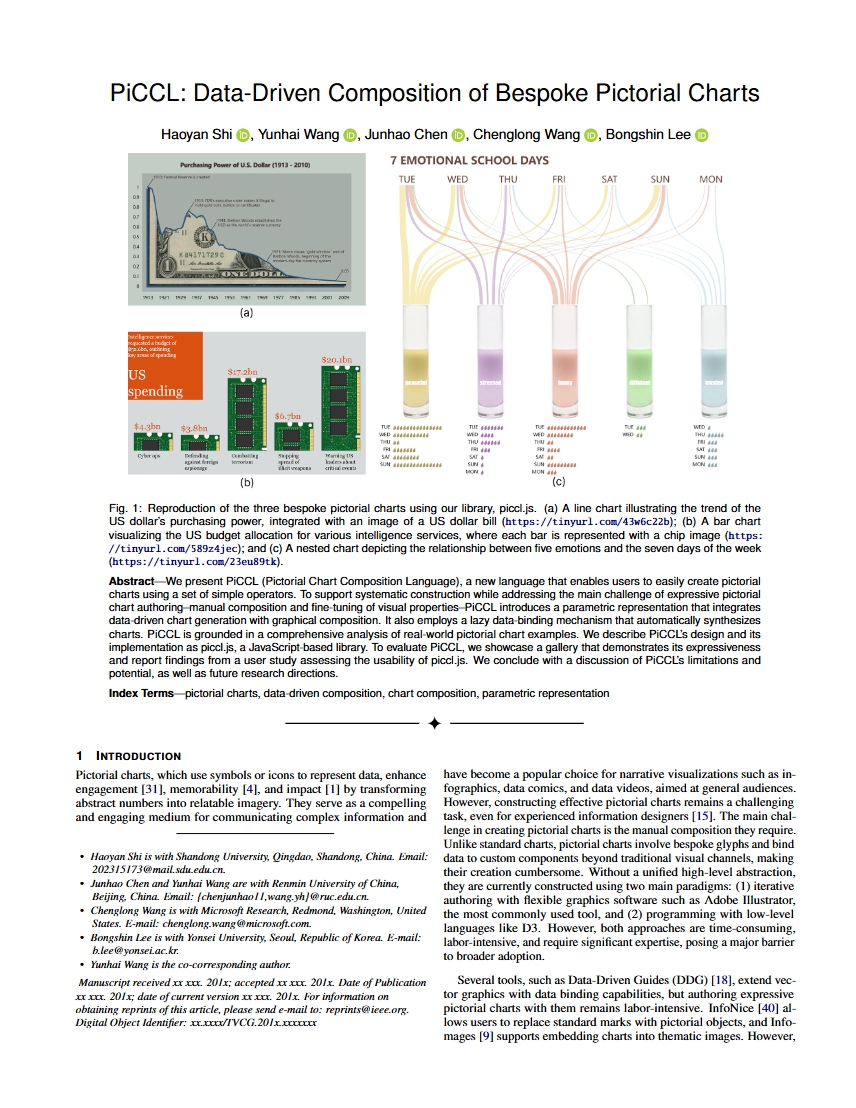
Figure 1: Reproduction of the three bespoke pictorial charts using our library, piccl.js. (a) A line chart illustrating the trend of the US dollar’s purchasing power, integrated with an image of a US dollar bill (https://tinyurl.com/43w6c22b); (b) A bar chart visualizing the US budget allocation for various intelligence services, where each bar is represented with a chip image (https://tinyurl.com/589z4jec); and (c) A nested chart depicting the relationship between five emotions and the seven days of the week (https://tinyurl.com/23eu89tk).
Abstract
We present PiCCL (Pictorial Chart Composition Language), a new language that enables users to easily create pictorial charts using a set of simple operators. To support systematic construction while addressing the main challenge of expressive pictorial chart authoring–manual composition and fine-tuning of visual properties–PiCCL introduces a parametric representation that integrates data-driven chart generation with graphical composition. It also employs a lazy data-binding mechanism that automatically synthesizes charts. PiCCL is grounded in a comprehensive analysis of real-world pictorial chart examples. We describe PiCCL’s design and its implementation as piccl.js, a JavaScript-based library. To evaluate PiCCL, we showcase a gallery that demonstrates its expressiveness and report findings from a user study assessing the usability of piccl.js. We conclude with a discussion of PiCCL’s limitations and potential, as well as future research directions.
Links
- Project Page: https://piccl.github.io/
- Source Code: https://github.com/PiCCL/
Design

Figure 2: Examples of pictorial charts from our dataset, showcasing various composition methods used for data encoding.

Figure 3: The syntax of PiCCL. Main building blocks of the chart, objects, are built of glyphs, encoded objects, collections, and links through four classes of composition operators. We use item∗ to represent list.

Figure 4: art-aware resizing of pictorial objects. (a) Resizing the entire chart distorts the top part highlighted by a dashed rectangle; (b) Resizing only the bottom section preserves the shapes of the other regions.

Figure 5: (a) Different operations combine two marks, A and B, with corre- sponding colors cA and cB, to yield a resulting color for each region. (b) This example illustrates each operation using marks A and B, as shown in the top left.

Figure 6: Illustration of four types of constraints.

Figure 7: An example of a pictorial chart (a), defined through a hierarchy of nested compositions (b).
Evaluation

Figure 8: Illustration of single-level combination for authoring a wine-themed pictorial bar chart (a) and a food-themed pictorial pie chart (c) using a sequence of operators, with corresponding piccl.js code snippets shown in (b) and (d). Replacing the pictorial object images in (a) and (c) results in the new theme-related bar chart (e) and pie chart (f).

Figure 9: llustration of nested combination for creating new pictorial charts. (a) An ISOTYPE bar chart is constructed using a sequence of operations. (b) The resulting chart is then combined with an emotion glyph, and the composite glyph is replicated to represent different emotions. (c) A code snippet demonstrating how to combine a pictorial chart with other objects using piccl.js.

Figure 10: reating a new pictorial chart by reusing components from other examples. (a) A pictorial chart where flower size, center’s x, y position, and root’s x position are used to encode four different variables. (b) A flower chart with petal lengths representing multiple variables. (c) A new chart created by replacing the flower glyph in (a) with the petal- based glyph from (b), allowing each flower to encode GDP values across various sectors.

Figure 11: (a-d) Top: the target pictorial charts used in the user study as tasks (these charts were created using piccl.js); bottom: the task comple- tion times in seconds, with error bars indicating standard deviations. (a) Task 1 – Clock-style pie chart composition; (b) Task 2 – intersect each icon with a blue bar; (c) Task 3 – multi-level mark and chart composition with layout adjustment; (d) Task 4 – nested repeat and glyph composition for decorated bar charts. (e,f) Two approaches to constructing a bar overlaid with multiple star icons.
Materials:
|
| Paper (10.5M) |
Acknowledgements
This work is supported by the grants of the National Key R&D Program of China under Grant 2022ZD0160805, NSFC (No.62132017 and No.U2436209), the Shandong Provincial Natural Science Foundation (No.ZQ2022JQ32), the Beijing Natural Science Foundation (L247027), the Fundamental Research Funds for the Central Universities, and the Research Funds of Renmin University of China. The authors thank Andrew M. McNutt and Oliver Deussen for their valuable suggestions.