AutoFDP: Automatic Force-based Model Selection for Multicriteria Graph Drawing
Mingliang Xue1
Yifan Wang1
Zhi Wang1
Lifeng Zhu2
Lizhen Cui1
Yueguo Chen3
Zhiyu Ding4
Oliver Deussen5
Yunhai Wang3
1Shandong University
2Southeast Universit
3Renmin University of China
4Independent Researcher
5University of Konstanz
Accepted by IEEE Transactions on Visualization and Computer Graphics
Abstract:
Traditional force-based graph layout models are rooted in virtual physics, while criteria-driven techniques position nodes by directly optimizing graph readability criteria. In this paper, we systematically explore the integration of these two approaches, introducing criteria-driven force-based graph layout techniques. We propose a general framework that, based on user-specified readability criteria, such as minimizing edge crossings, automatically constructs a force-based model tailored to generate layouts for a given graph. Models derived from highly similar graphs can be reused to create initial layouts, users can further refine layouts by imposing different criteria on subgraphs. We perform quantitative comparisons between our layout methods and existing techniques across various graphs and present a case study on graph exploration. Our results indicate that our framework generates superior layouts compared to existing techniques and exhibits better generalization capabilities than deep learning-based methods.
Source Code: https://github.com/IDEASLab-AutoFDP/AutoFDP
Results:
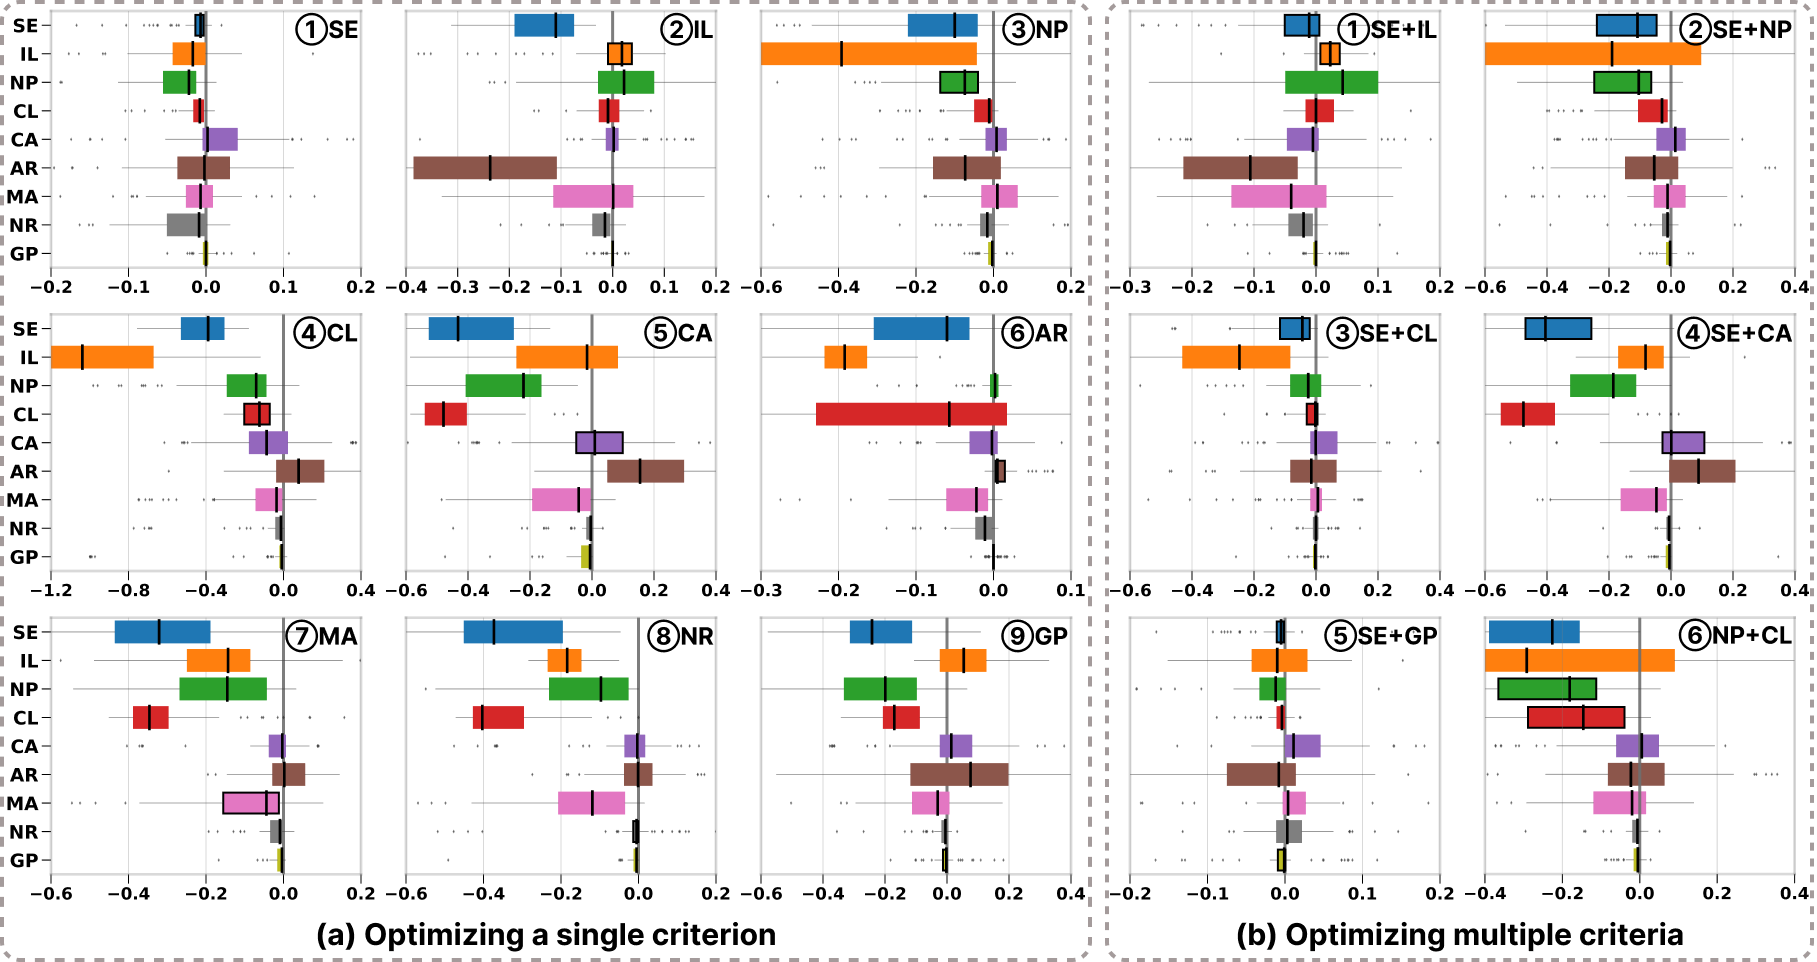
Figure 1: Quantitative comparison between our method and SGD2:(a,b) Boxplots summarize the difference between the layouts generated by two methods of optimizing a single criterion (a) and weighted criteria (b). The optimized criterion on each sub-figure is listed on the top right.
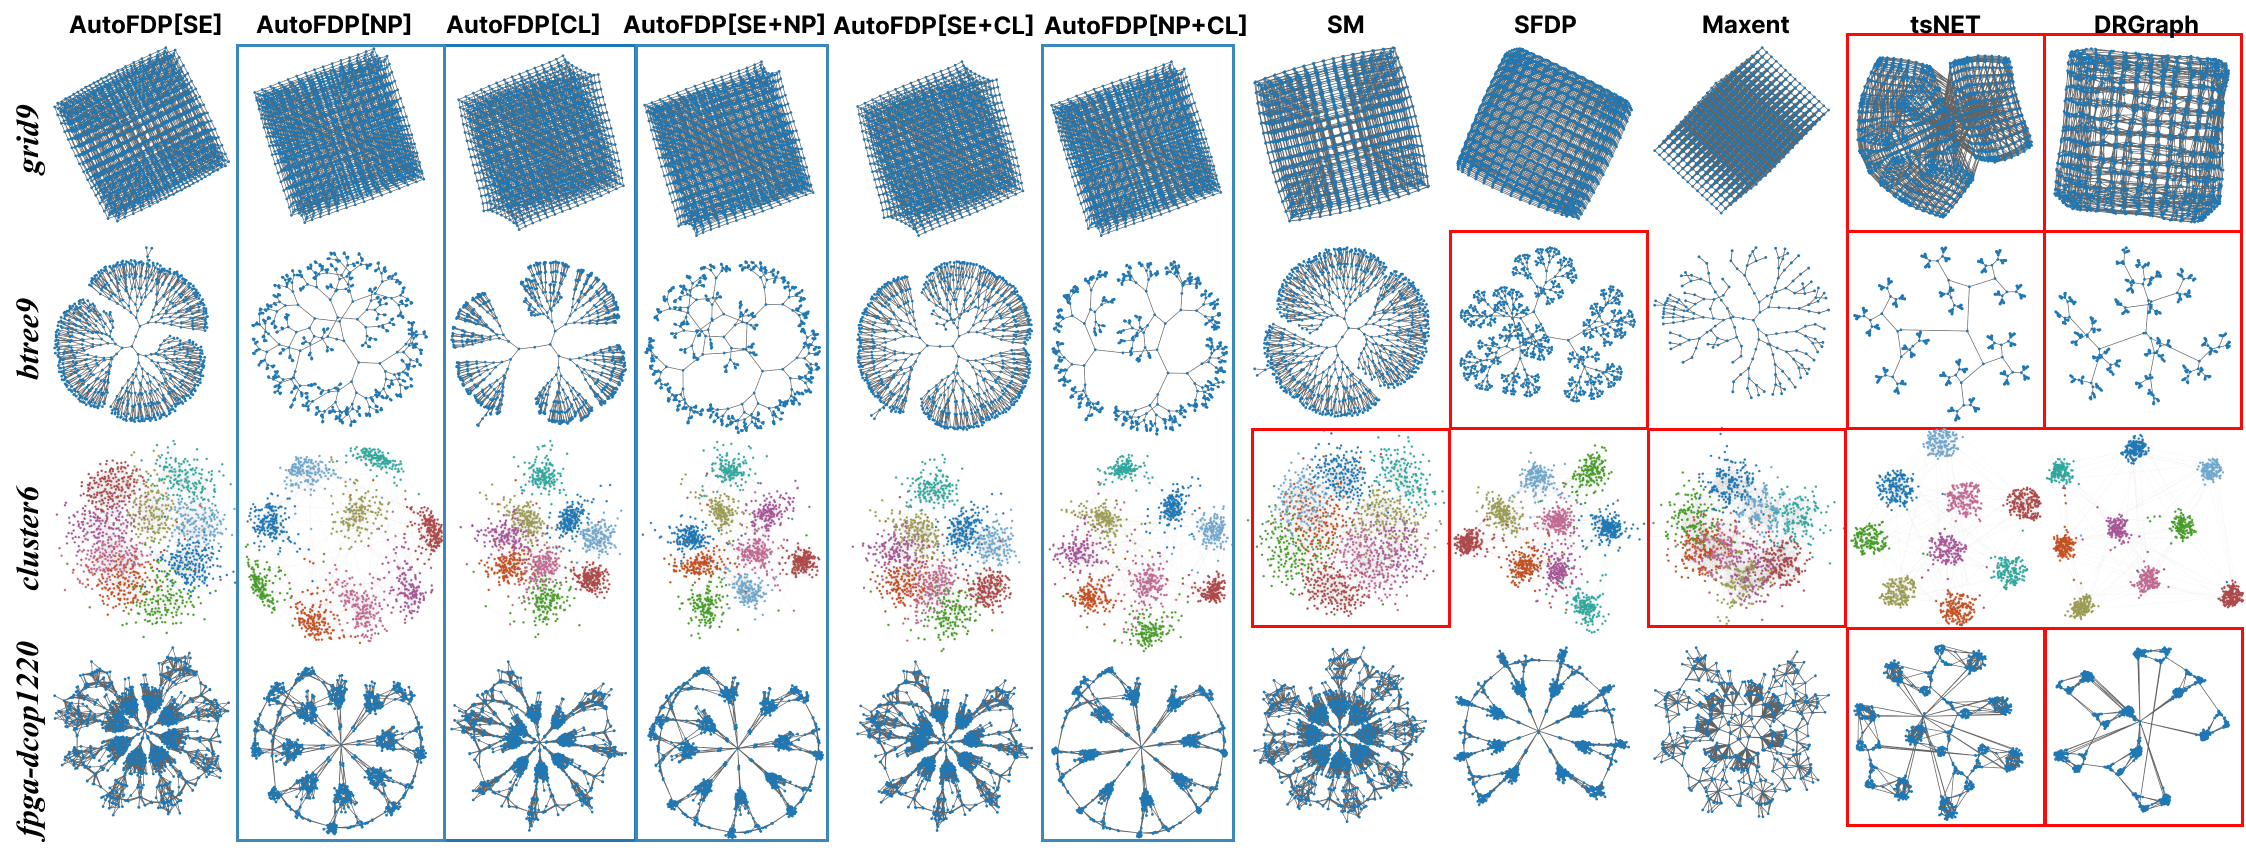
Figure 2: Example layouts generated by six variant of AutoFDP and five force-based methods for the four types of graphs: grid (top row), tree (second row), clustered graph (third row), and real graph (bottom row). The blue boxes represent well-perform layouts, the red boxes represent layouts where structures are not visually represented well.
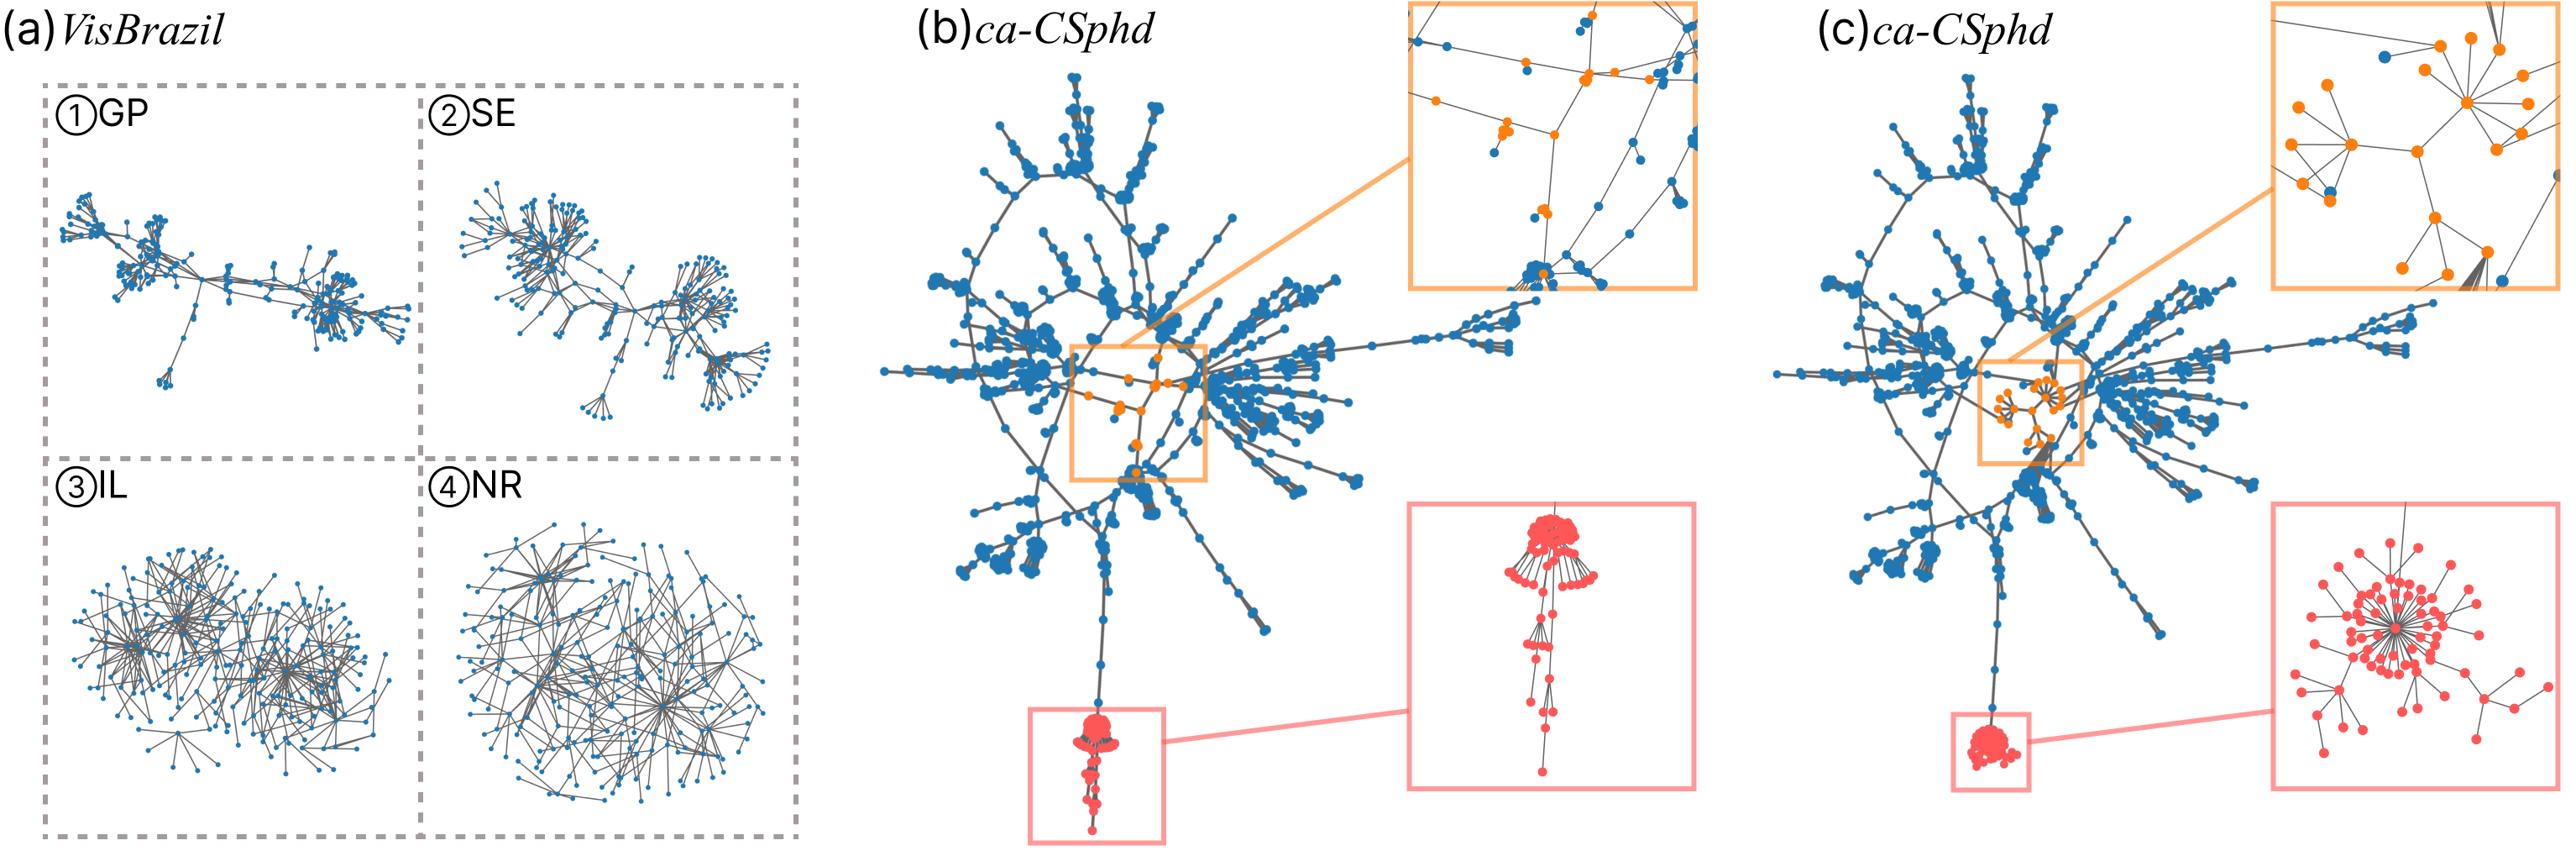
Figure 3: Generating layout of a new graph with the reuse-and-optimization scheme. (a) Four layouts of the graph VisBrazil provided by AutoFDP with four different criteria; (b) A layout generated by reusing the force-based model in (a)(1) to the graph ca-CSphd;(c) Refining the layout by applying AutoFDP[SE] and AutoFDP[MA] to the orange and red subgraphs selected in (b), respectively.
Materials:
 |
 |
| Paper (8.5 MB) | Supp. (53.7 MB) |
Acknowledgements:
The authors like to thank the anonymous reviewers for their valuable input. This work is supported by grants from the NSFC (No.62402284, No.92367202, No.62132017, and No.U2436209), NSF of Shandong province (No.ZR2024QF212 and No.ZQ2022JQ32), National Key R&D Program of China (No.2022ZD0160805), the Beijing Natural Science Foundation (No.L247027), the Fundamental Research Funds for the Central Universities, and the Research Funds of Renmin University of China.